The Price to Fill Your Screen
,The video game business has changed a lot in the past 40 years. Game systems have grown more powerful, and the TVs they’re plugged into have gained a much higher pixel density. Generally speaking, development cost has increased as well. This got me wondering, what kind of relationship does screen size have with game development budgets?
The Quest For Higher Def
Video games are played on screens, so game technology is intrinsically linked to display technology. For decades, the most ubiquitous screens people had in their homes has been TVs, so the consumer TV market has always set the benchmark for what game systems, and the software running on them, should be able to do.
When the Famicom/NES came on to the scene in 1983, it supported an output resolution of 256x240 pixels. That is, 256 pixels wide and 240 pixels tall. The height of 240 scan lines was the standard for analog TV, and this resolution retroactively became known as Standard Definition (SD). For console game systems, this 240-line height was the norm from the NES, through Sega Master System, Sega Mega Drive/Genesis, Super Famicom/SNES, Sega Saturn, Sony PlayStation, and N64. That’s over 20 years of standard def dominance!
In the 1990s, in the midst of SD’s reign, the gaming world expanded into polygons, propelled by advances in 3D rendering and CD-ROM technology. Production values and development budgets increased to meet the potential. Then at the end of 90s decade, everything came together TV technology began expanding into High Definition (HD) resolutions.
As the game industry entered into its Fifth Generation (PS2, GCN, Xbox, Dreamcast) in the year 2000, output resolutions doubled to 480p, or a 480-line height. Then the Sixth Generation (PS3, Xbox 360, etc.) brought a 2.25x increase to 1080p. While the Seventh Generation (PS4, XB1, Switch) stayed steady at 1080p, we have just seen another doubling with the introduction of the Eighth Generation (PS5, XBSX|S). What this means is, over the past 40 years or so, output resolution has been increasing closely to an exponential rate.
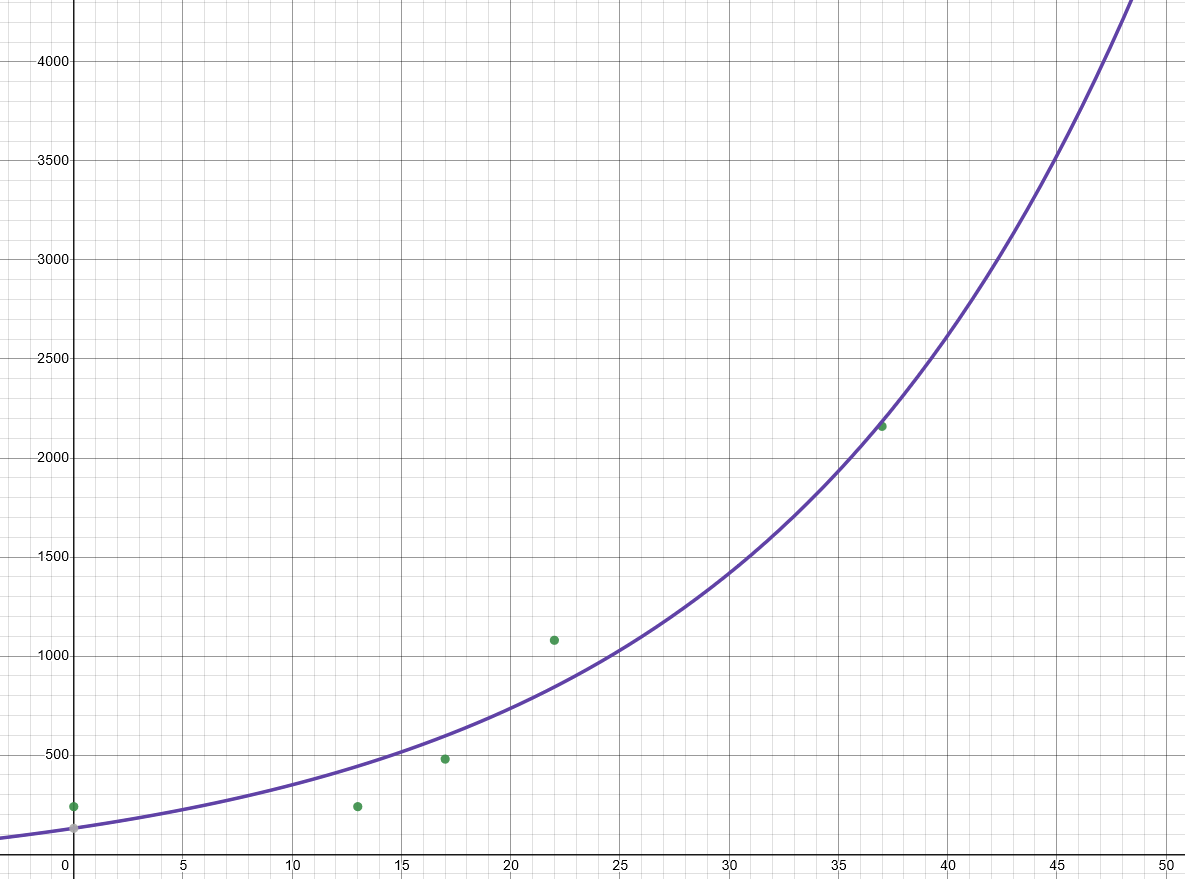
Exponential growth of console output resolutions. I guess 8K consoles will be coming around 2030-2032… we’ll see!
Meeting The Pace of Change
As display technology has become more advanced, game developers have constantly risen to the occasion with sharper graphics, crisper audio, and faster action. As the technology behind games has changed, the skills and tools needed to create them have changed too. Productions became more complex, and demanded larger teams.
While the state-of-the-art has evolved, the gaming public’s tastes have kept in tune too. Staying competitive in the eyes of the critical public demanded that developers increase production values of their games. In this environment, developers who couldn’t adapt to shifting technical constraints and consumer expectations perished.
Since around 1990, a new wave of game systems has been coming out about every 5 years or so. To keep up with the times, these competitive developers have had to adapt their productions to these new systems. But not all platforms are equal! Developing a GBA game was obviously a less expensive affair than a AAA game on Xbox 360. Anybody who’s familiar with either system can tell you that the differences in capability are vast.
Screen Height as Proxy for Potential?
Interestingly enough, the GBA was a handheld system with a screen height of 160 lines. It was prominent in the early 2000s, alongside its console bretheren which were blazing the trail into 480p. So I had a hypothesis… can we use screen height as some kind of general benchmark for technical potential?
The GBA also started a rule-of-thumb that a given console generation’s handhelds could generally match the power of the consoles from two generations prior. So a GBA’s power was comparable to the SNES (Super Mario World: Super Mario Advance 2), DS to N64 (Super Mario 64 DS), 3DS to GCN (Luigi’s Mansion) and so on.
Through this stretch of time, two console generations was roughly equivalent to 10 years. Trying to make a Nintendo 64 game would have been a lot easier in 2006 than it was in 1996. After all, a developer in 2006 would have 10 years of technical progress at their disposal. So, if screen height is a measure of potential, is there a way we can we compare screen heights with game budgets, and derive some industry-wide indicator of efficiency or technical mastery?
Gleaning Some Intel
Since I was curious, I decided to try and take a look. After all, it must be easy to examine 40 years of game dev budgets, right? Well, unfortunately the game industry is notoriously secretive, and production budget numbers are some of the most closely guarded business secrets in the industry. Fortunately, various industry insiders have been willing to talk in the abstract over the years, giving me enough breadcrumbs to start piecing it together.
There’s also the fact that this is a complex problem with multiple variables. The games market has become more mature and specialized since 1983, and there have been large market fragmentations over the years: the invention of handheld systems and smartphones, the emergence of indie-friendly downloadable distribution platforms, and the introduction of alternative revenue strategies like free-to-play and subscription models. So for this analysis I thought to narrow the focus on full-price games for console and handheld systems. Also, I don’t want to get into the time durations of dev cycles… I am just attempting to focus on the total development cost.
It’s also an exploration that spans four decades. If we want to compare budgets across generations, we need to make sure everything is adjusted for inflation and expressed in today’s dollars.
So, given all those caveats, here’s a peek of what I came up with:
Some additional notes about this data:
- These all should be considered ballpark numbers, and taken with a grain of salt!
- A lot of these numbers were gathered from this page on the Video Game Sales Wiki
- The budget numbers highlighted in yellow were educated guesses based on the relative development costs from a 2005 CEDEC survey in Japan
- I could not really find any data about the costs of developing for SEGA systems like Master System, Genesis, Game Gear, Saturn or Dreamcast, so they are omitted.
- I could not find anything definitive about Wii U or PS Vita development budgets.
- Switch crossed over the worlds of console and handheld. So, there is not really an average development budget case.
Insights Gained
In looking at these numbers, in all their flaws, I did have some general insights.
First of all, the “dollars per scanline” metric seems to spike when new technologies cause a paradigm shift, then drops as developers become accustomed to the tech. Perhaps my theory holds water… but unfortunately I don’t think this data set is strong enough to confirm it. So from here on out is a bit discursive! But I still had more to think about:
- The jump to HD caused a massive shift. Games became at least 10x more expensive to make when we jumped from 480p to 1080p.
- When games became 10x more expensive to make, games had to sell 10x more copies to break even. Despite this, the increased dev cost was not complimented by 10x market growth. The combined install base for Sony and Microsoft consoles has stayed consistent at around 170 million since 2000, when games were still in 480p.
- The “jump to HD” in 2005 parallels the “jump to 3D” in 1995. Games became 10x-20x more expensive to develop for the PS1 than they were for the SNES.
- The MSRP of full-price games has lost a lot of value to inflation. There was a $10 industry-wide MSRP bump in 2005, but by that time over $20 of value in today’s dollars had already been lost compared to 1989. That $10 price bump only reclaimed about $6 of value. We’ve lost another $26 since then.
- So while dev budgets for full-price games have ballooned 50x-100x since SNES, the inflation-adjusted full MSRP has lost about 40% of its value in the same time.
- The handheld world stayed relatively steady, despite HD making things a headache on consoles.
- 2D pixel art games are probably the cheapest kind of games you can make!
Lessons For Today
Although I may not have adequately answered my original question, I still feel like I came away with a better understanding of how the market evolved, and where that has led us today. It is pretty staggering to think about those technological paradigm shifts that have driven massive changes in game production economics.
Something that this data misses is too is all of the ways the games market has evolved to allow for different scales of production to coexist. While $50,000,000 games do happen, there are also $5,000,000 games, $500,000 games, and $50,000 games. Unfortunately, their MSRP is scaled relative to the full-price games… they might end up being sold for $40, $30, $20, or $10. Now that Switch has crossed the handheld world over with consoles, is a certain production tier potentially today’s equivalent of yesterday’s “handheld” games?
As ever, there is also a business case for novel technical optimization. If a studio manages to come up a technique or process that can yield competitive games at 1/10th of the cost, they can claw back the value that has been lost to the march of screen sizes. That may seem outlandish or even impossible, but I can’t help but wonder, what would that look like?